Transformation Part 1 - Assessing Your State of Culture
Understanding your organization’s current state is fundamental for effective transformation.
Change Log
- Updated to version 1.0.0
- Added major revisions to the transformation framework.
- Changed the overall structure and flow of the content.
- Removed outdated examples and replaced them with more relevant case studies.
- Enhanced the visual design and layout for better readability.

TL;DR
- Diagnose first: locate your organization on the S-curve to anticipate near-term stresses and strategic options.
- Track two core metrics: If the business is healthy, low Time-to-Productivity + high Duration-of-Employment = healthy; rising Time-to-Productivity + falling Duration-of-Employment = early warning of decline.
- Turn metrics into a leading signal: Cultural Drag Index = Time-to-Productivity / Duration-of-Employment. Lower is better. Reduce CDI with transparency, flat hierarchies, and streamlined processes; avoid politics and manual churn.
- Expect a cultural dip during deep change: culture health often falls before it rebounds and pulls business health upward—plan communication, support, and pacing.
- Decide with data: baseline Time-to-Productivity/Duration-of-Employment by role, monitor Cultural Drag Index trends, pick targeted interventions to shorten Time-to-Productivity and increase Duration-of-Employment, then re-measure.
Why You Should Read This
The Starting Line: Where Do You Truly Stand?
Before you can embark on any transformation journey, it’s fundamental to accurately assess your organization’s cultural health. Why? Because if technology is the train, then culture is the tracks. Without a solid foundation of cultural alignment, even the most advanced technological transformation will eventually derail.
This article will provide you with a clear framework for assessing your current cultural state and provide effective measurement techniques. Part 2 will explore the methodologies and strategies for leaders to create sustainable change. In Part 3, we’ll examine how to establish controlled organizational self-disruption and assess whether your business still has a viable path forward or needs a fundamental rethink.
The Imperative of Continuous Transformation
In an era defined by relentless change, organizational transformation is no longer an option—it’s a strategic imperative for survival and growth. From technological disruption to evolving market demands and dynamic workforce shifts, businesses must continually adapt their fundamental structures, processes, and cultures. This ongoing necessity for deep-seated change is particularly evident when you consider the evolution of industries over time.
It’s crucial to distinguish true transformation from mere digitalization. While digital tools are essential enablers, they are not the cure for underlying organizational issues. This distinction is often blurred, especially amidst the current enthusiasm surrounding Artificial Intelligence (AI) and the broader AI hype bubble. Digitalization can streamline interfaces and workflows, potentially reducing time-to-productivity, but it cannot fix mistrust, poor leadership, or internal miscommunication. In some cases, it can even amplify dysfunction by accelerating the speed at which problems propagate.
Think of a legacy train retrofitted with an electric motor. It goes faster and looks cleaner, but it still runs on a one-dimensional track built decades ago. That’s what digitalization often achieves: acceleration without true reimagination. Transformation, however, requires you to question the track itself. Why not fly?
The journey of transformation can be vividly visualized as the evolution of mobility, moving from the robust, steam-powered locomotive to the sleek, electric high-speed train. This transition represents more than a simple upgrade in speed or capacity; it signifies a fundamental shift in the underlying propulsion system, infrastructure, and operational model. This profound change mirrors the radical shifts organizations must undertake to remain competitive and relevant. Organizational transformation, in this context, refers to “deep, fundamental, (and often radical) changes in an organization’s mission, structures, systems, culture, processes, and ways-of-working, as opposed to incremental improvements.” Such initiatives frequently involve comprehensive consolidation, reengineering processes, restructuring hierarchies, or significant cultural shifts to align with new strategic directions.
This article, the first in a three-part series, will focus on the critical initial phase: assessing the current state of the organization. We’ll delve into the multifaceted nature of organizational dynamics, exploring predictable growth phases, the critical internal dynamics of productivity and employee tenure, the often-overlooked impact of cultural drag, and the delicate balance between business and cultural health. By integrating visual models and academic insights, this analysis aims to provide a holistic framework for diagnosing an organization’s current position and identifying areas ripe for transformation.
The understanding that transformation demands a complete overhaul, not just incremental improvements, is foundational to approaching these complex initiatives effectively. Failure to grasp this depth frequently leads to “transformation” efforts that are merely superficial adjustments, unable to address the core challenges an organization faces.
Organizational Growth Beyond the Standard S-Curve Perspective
Organizational growth, much like the adoption of new technologies or the development of economies, frequently follows a predictable S-curve trajectory. This model acknowledges that growth is cyclical, featuring distinct periods of slow beginnings, rapid acceleration, maturity, and potential decline, rather than a simple linear progression. Understanding an organization’s current position on this curve is crucial for anticipating upcoming challenges and aligning strategic efforts accordingly. The S-curve framework allows for various scenarios and trajectories, emphasizing that while the phases are common, the specific challenges and strategic responses within each can differ significantly based on internal and external factors.
The S-curve serves as a powerful model for understanding the organic phases every company experiences, capturing the natural ebb and flow of business development. It is not merely a descriptive model of growth but also a predictive tool for identifying when an organization will encounter specific types of stress. The challenges inherent in each phase necessitate a proactive strategic response.
Phases of the Organizational S-Curve
The S-curve for organizational growth can be broken down into four distinct phases as shown in Figure 1 below:
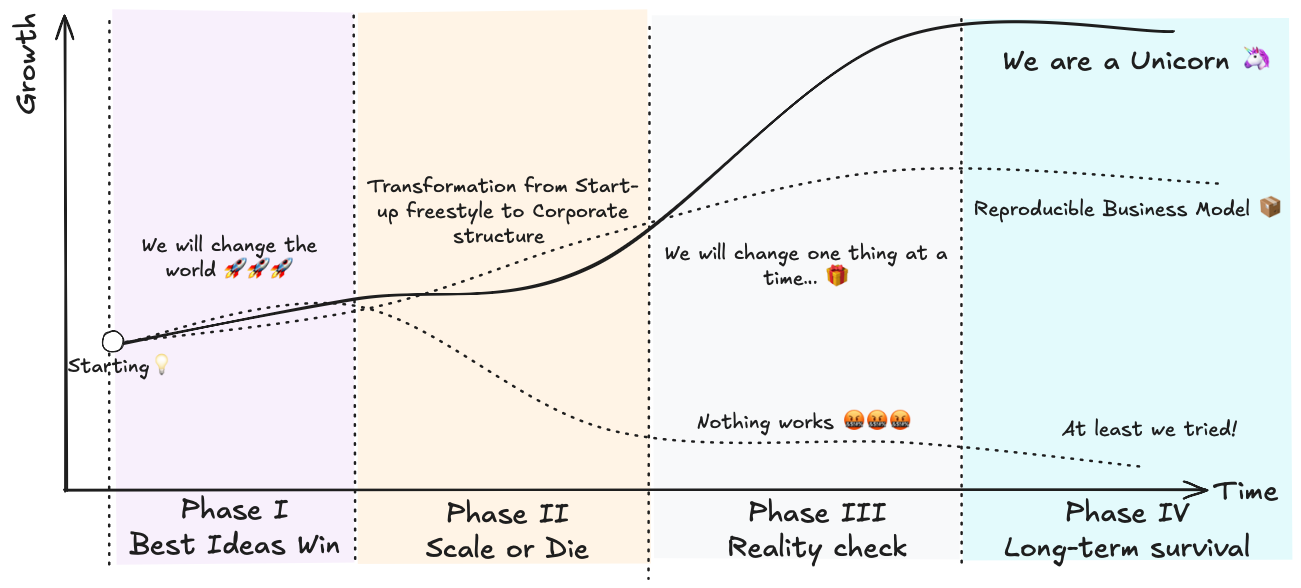 Figure 1: Organizational Lifecycle across different phases and for various outcomes.
Phase I: Best Ideas Win (Learning or Launch Phase)
This phase sees slow, foundational growth, often driven by an entrepreneurial spirit, agility, and a strong focus on validating core ideas. The sentiment is often one of boundless ambition, such as “We will change the world.” The primary emphasis during this stage is on innovation and proving the viability of the core concept. Strategic efforts are concentrated on experimentation, achieving product-market fit, and establishing an initial customer base.
Phase II: Scale or Die (Early Growth Phase)
If Phase I proves successful, the organization enters a period of rapid growth. This stage involves a significant “Transformation from Start-up freestyle to Corporate structure.” While visible progress is substantial, new challenges inevitably emerge, particularly concerning scaling operations and effectively managing a rapidly expanding team. The transition from an agile, informal startup environment to a more structured corporate entity is a critical and often demanding process. Strategic focus shifts towards building repeatable processes, expanding infrastructure, formalizing roles, and attracting and retaining the necessary talent to support accelerated growth. This phase inherently brings structural and cultural challenges as the initial “start-up freestyle” encounters the demands of a more formal “corporate structure.”
Phase III: Reality Check (Mature Growth Phase)
In this phase, growth begins to slow as the market matures or becomes saturated, and competition intensifies. The initial dynamism may wane, and the organization might find itself in a state where it feels compelled to “change one thing at a time…” This stage demands a strategic shift from aggressive expansion to optimizing existing operations and maintaining market share. This period represents a critical juncture where organizations confront the stark reality of their internal capabilities and market position. The dotted line in Figure 1, illustrating “Nothing works,” highlights the potential for stagnation or decline if proactive measures are not taken. The strategies that drove rapid growth in Phase II are often insufficient here, demanding innovation or optimization.
Phase IV: Long-term Survival (Pinnacle/Decline Phase & Reinvention)
This final phase represents either a plateau of sustained existence, characterized by a “Reproducible Business Model,” or a potential decline if innovation ceases (“At least we tried!”). For long-term survival, organizations must either master the art of reproducibility or initiate a new S-curve through continuous innovation, diversification, or reinvention. The ultimate goal is to evolve into a “Unicorn” – a highly successful and sustainable entity. Strategic focus in this phase includes continuous innovation, market diversification, forging strategic partnerships, and maintaining a competitive advantage through ongoing cultural evolution.
The S-curve’s progression is not solely an internal phenomenon; external market conditions, such as saturation and increased competition, significantly influence the transition between phases. However, an organization’s ability to navigate these external shifts is heavily dependent on its internal structural and cultural readiness. For example, the necessary move from a “freestyle” to a “corporate structure” in Phase II is an internal transformation required to handle external scale. If this internal transformation is poorly executed, it can lead to the “Nothing works” scenario, even if market opportunities still exist. This underscores the critical link between internal organizational design and external market responsiveness.
To provide a clearer overview of these stages, the following table summarizes the key characteristics and strategic focus of each phase:
Table 1: Phases of Organizational S-Curve Growth
| Phase Name | Key Characteristics | Strategic Focus | Associated Challenges |
|---|---|---|---|
| Phase I: Best Ideas Win | Slow, foundational growth; entrepreneurial spirit; focus on validating core ideas (“We will change the world “). | Experimentation, product-market fit, establishing initial customer base. | Limited resources, proving concept, market acceptance. |
| Phase II: Scale or Die | Rapid growth; transition from “Start-up freestyle to Corporate structure”; visible progress. | Building repeatable processes, expanding infrastructure, formalizing roles, attracting and retaining talent. | Scaling operations, managing growing teams, maintaining agility, cultural friction. |
| Phase III: Reality Check | Growth slows; market matures/saturates; increased competition; focus on “one thing at a time…”; potential for “Nothing works .” | Efficiency, cost optimization, market differentiation, exploring new revenue streams, fostering continuous improvement. | Stagnation, declining morale, resistance to change, maintaining relevance. |
| Phase IV: Long-term Survival | Plateau of sustained existence (“Reproducible Business Model”) or potential decline; goal to become a “Unicorn.” | Innovation, market diversification, strategic partnerships, continuous cultural evolution, maintaining competitive advantage. | Avoiding complacency, initiating new S-curves, managing decline if reinvention fails. |
Measuring Internal Dynamics: Organisational Health, Time-to-Productivity (TTP) and Duration-of-Employment (DoE)
Beyond the macro S-curve trajectory, successful organizational transformation hinges on understanding crucial internal metrics that reflect an organization’s operational efficiency and human capital stability. Time-to-Productivity (TTP) and Duration-of-Employment (DoE) are two such vital indicators. Their interplay offers a granular view of an organization’s internal health.
Defining Organisational Health
Organisational Health refers to the overall effectiveness of an organization in achieving its goals while maintaining a positive work environment. It encompasses the dimensions of culture, technology, business and leadership. A healthy organization fosters a culture of trust, innovation, and continuous improvement, enabling it to respond effectively to internal and external challenges.
While Organisational Health is a broad concept, it can be measured through various indicators described in the following sections.
Defining Time-to-Productivity (TTP)
Time-to-Productivity (TTP) measures the period it takes for new hires to reach a desired level of performance, demonstrating the necessary skills, knowledge, and ability to perform key tasks independently. This period can vary significantly, ranging from weeks to typically 8 months or even up to a year for an employee to reach full productivity, depending on the role’s complexity and industry.
Measuring TTP involves a clear process: first, defining what “fully productive” means for a specific role, which could be based on sales targets, project completions, or achieving certain performance milestones. Second, determining a start point, typically the new hire’s first day, and an end point, when predefined productivity benchmarks are met. The duration between these points is the TTP. For instance, if a software developer starts on January 1st and is fully productive by April 1st, their TTP is three months.
The importance of TTP cannot be overstated. Shorter TTP directly translates to cost savings for the organization by reducing the time and resources required for training and support. It also contributes to higher employee engagement and retention, as individuals who quickly feel confident and productive are more likely to be satisfied with their roles and leadership. Furthermore, improved TTP contributes to overall organizational performance and growth by ensuring new employees contribute quickly and efficiently to company goals. TTP also provides insights into the effectiveness of onboarding programs, helps refine hiring strategies, and identifies potential skills gaps within the workforce. Factors influencing TTP include the complexity of the role, the new hire’s prior experience and skills, the quality of training and support provided, and the overarching organizational culture and communication.
Defining Duration-of-Employment (DoE)
High Duration-of-Employment generally indicates organizational stability, effective talent retention, and the preservation of crucial institutional knowledge within the workforce. Conversely, low DoE, or high employee turnover, can be significantly costly and disruptive, negatively impacting productivity, organizational learning, and overall morale.
Depending on the industry, the average DoE can vary widely. For example, in technology sectors, where rapid innovation is common, employees may have shorter tenures as they move between projects or companies. In contrast, industries like healthcare or education may see longer tenures due to the specialized knowledge and relationships built over time. The sweet spot for DoE often lies in balancing the need for fresh perspectives with the value of deep institutional knowledge.
The Zones of Organizational Health
This section explains in more detail the intricate interplay between TTP and DoE, defining three critical zones that reflect an organization’s health. Figure 2 shows various zones as well as one scenario for the time evolution of TTP and DoE. For simplicity, this chapter assumes business is healthy. Business health and its interplay with organizational health will be discussed in more detail in the section Business and Culture in Transformation and in great detail in Transformation Part 3 - Controlled Self-Disruption.
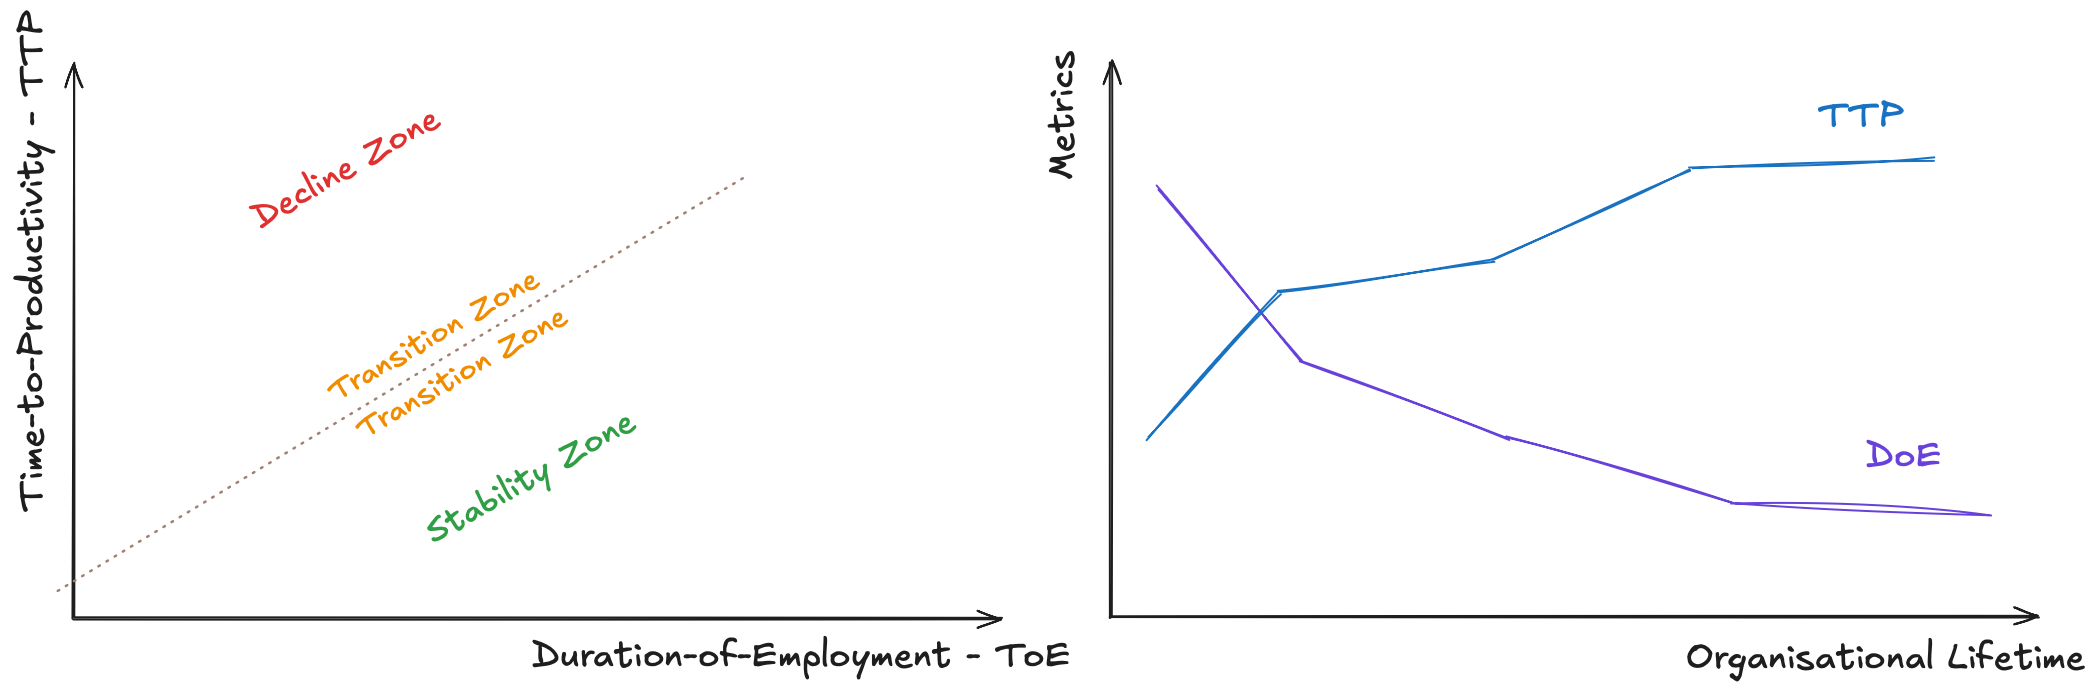 Figure 2: (Left) Time-to-Productivity vs. Duration-of-Employment. (Right) Evolution of Time-to-Productivity and Duration-of-Employment.
- Stability Zone (Green): This is the ideal state, characterized by low Time-to-Productivity and high Duration-of-Employment. It signifies efficient onboarding processes, effective knowledge transfer, and a stable, experienced workforce. In this zone, new employees quickly become productive, and existing employees remain with the organization long-term, contributing consistently and building institutional knowledge.
- Transition Zone (Orange): This zone represents an area where organizations are moving between stability and potential decline. It could involve an increasing TTP (indicating slower ramp-up for new hires or slower adaptation to change) or a decreasing DoE (signaling rising employee turnover). These shifts serve as early warnings of potential issues that require attention before they escalate into more severe problems.
- Decline Zone (Red): This zone is a critical warning sign, marked by high Time-to-Productivity and low Duration-of-Employment. In this state, new hires take excessively long to become productive, and experienced employees are leaving the organization at an accelerated rate. This leads to a significant loss of institutional knowledge, a perpetual state of inefficiency, and a struggle to maintain operational effectiveness.
The relationship between TTP and DoE is not merely a static snapshot but a dynamic interplay that can serve as a powerful leading indicator of an organization’s health and its capacity for successful transformation. A move from the Stability Zone towards the Transition or Decline Zone (e.g., increasing TTP, decreasing DoE) signals underlying systemic issues—be it ineffective onboarding, poor talent retention, or a struggling internal culture—before these problems manifest as severe business performance declines. Proactively monitoring and managing these metrics allows leaders to intervene early, addressing root causes rather than simply reacting to symptoms.
TTP and DoE Over Organizational Lifetime
The left graph in Figure 3 illustrates the evolution of TTP and DoE metrics against “Organizational Lifetime.” Initially, both metrics might be in flux as an organization establishes itself. As an organization matures and stabilizes, TTP tends to decrease as processes become more streamlined and knowledge transfer improves. Correspondingly, DoE might increase, reflecting a stable and experienced workforce.
However, the graph depicts a concerning scenario where, over time, TTP increases while DoE decreases. This divergence is highly problematic, indicating a decline in organizational efficiency (it takes longer to get things done, or for new people to contribute effectively) coupled with a significant loss of experienced talent. While TTP is important metric, its application in this context suggests a broader interpretation in the context of organizational transformation. An increasing TTP over an organization’s lifetime, especially when coupled with decreasing DoE, can signify a declining organizational learning capability, where it takes longer for anyone—new hires or existing employees adapting to new roles or technologies—to become proficient. This points to potential issues with training, overly complex systems, or internal resistance to change. Furthermore, as DoE decreases due to high turnover, the organization loses experienced individuals who could otherwise accelerate the TTP of others, creating a detrimental cycle where new talent struggles due to a lack of mentorship and established knowledge. If the organization is undergoing transformation, an increasing TTP might also reflect the difficulty of existing employees to adapt to new processes, tools, or cultural norms, effectively acting as a drag on overall organizational productivity. This broader interpretation elevates TTP from a simple HR metric to a critical indicator of an organization’s dynamic adaptability and internal health during periods of change.
To summarize these crucial internal metrics, the following table provides a concise overview:
Table 2: Key Internal Metrics: Time-to-Productivity (TTP) and Duration-of-Employment (DoE)
| Metric | Definition (in this context) | Significance for Organizational Health | Key Influencing Factors |
|---|---|---|---|
| Time-to-Productivity (TTP) | The time it takes for new hires to reach a desired level of performance and operate independently in their role. | Shorter TTP indicates efficient onboarding, faster ROI on talent, higher engagement, and improved organizational performance. | Role complexity, prior experience, quality of training/support, organizational culture/communication. |
| Duration-of-Employment (DoE) | The length of time employees remain with the organization (employee tenure). | Higher DoE indicates stability, retention of institutional knowledge, lower recruitment costs, and potentially stronger culture. | Employee satisfaction, career development opportunities, compensation, management quality, organizational culture. |
The Unseen Force: Cultural Drag Index (CDI)
Beyond tangible metrics like TTP and DoE, an organization’s culture exerts a profound, often unseen, influence on its ability to transform. “Cultural Drag” refers to the inertia, resistance, or misalignment within an organizational culture that impedes progress and efficiency. Cultural drag, in essence, quantifies “what ineffective structures, systems, and culture may be costing you in squandered time and energy – hidden costs that don’t appear in traditional financial accounting systems”. Figure 3 shows the cultural drag’s influence on organizational health zones and its evolution over the S-Curve.
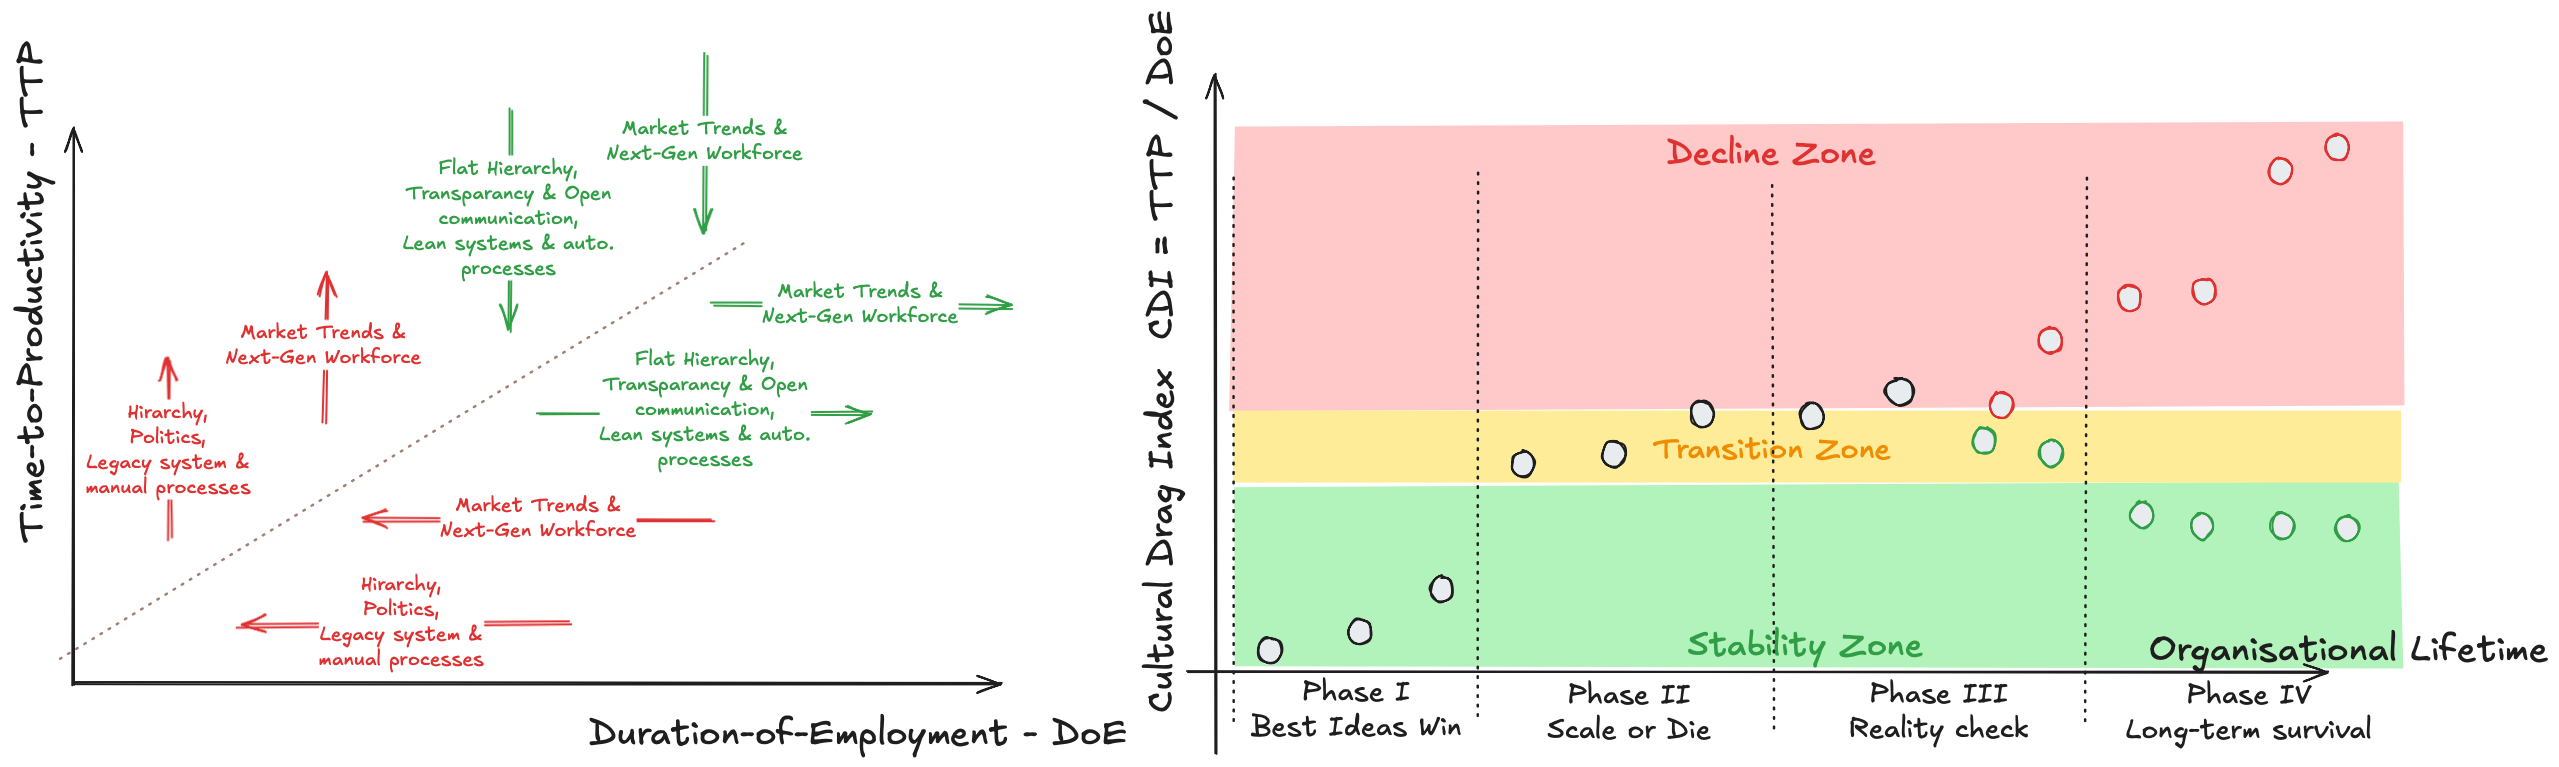 Figure 3: (Left) External and internal influences on the Time-to-Productivity and Duration-of-Employment. (Right) Cultural Drag Index defining different cultural health regimes.
CDI’s Interplay with TTP and DoE
The left graph in Figure 3 shows how cultural and structural elements influence TTP and DoE, and consequently, an organization’s position within the health zones:
- Positive Influences (Green Arrows): Factors such as “Flat Hierarchy, Transparency & Open Communication,” “Lean systems & streamlined processes,” and strong alignment with “Market Trends & Next-Gen Workforce” actively reduce TTP and increase DoE. These elements foster an environment where employees quickly become productive and are motivated to stay, pushing the organization towards the Stability Zone. This demonstrates that a positive, adaptable culture directly contributes to operational efficiency and talent retention.
- Negative Influences (Red Arrows): Conversely, attributes like rigid “Hierarchy, Politics, Legacy system & manual processes,” and a significant disconnect from “Market Trends & Next-Gen Workforce” increase TTP and decrease DoE. These are classic manifestations of cultural drag, making it harder for individuals to contribute effectively and driving talent away, thereby pushing the organization towards the Decline Zone.
The Cultural Drag Index (CDI) is implicitly defined here as a ratio or function of TTP and DoE (CDI = TTP / DoE), where a higher ratio indicates greater cultural drag. This relationship highlights a clear cause-and-effect: cultural elements are not merely “soft” factors but have a direct, measurable impact on “hard” business metrics like productivity and employee retention. A positive, adaptable culture, characterized by transparency, lean processes, and flat hierarchies, leads to lower TTP and higher DoE, resulting in a lower CDI and greater organizational stability. Conversely, a rigid, political culture leads to higher TTP and lower DoE, resulting in a higher CDI and pushing the organization towards decline. This emphasizes that cultural transformation is not just a desirable outcome but a fundamental driver of operational efficiency and talent management, directly influencing the success or failure of broader organizational change initiatives.
CDI Across Organizational Lifetime
The right graph in Figure 3 maps the Cultural Drag Index (CDI) against “Organizational Lifetime” and the S-Curve phases (Phase I to IV), providing a dynamic view of how cultural drag evolves:
- Phase I (Best Ideas Win): During the initial startup phase, CDI is typically low, reflecting the inherent agility, minimal bureaucracy, and highly collaborative nature of a nascent organization.
- Phase II (Scale or Die): As the organization grows and formalizes its structures, CDI begins to rise. This period falls within the “Transition Zone,” where the initial “freestyle” culture starts to encounter friction with the emerging “corporate structure.” The necessary introduction of structure and processes can inadvertently introduce bureaucracy and internal politics, thereby increasing cultural drag.
- Phase III (Reality Check): CDI continues its ascent, pushing the organization further into the “Decline Zone.” This phase, where growth typically slows, is often when cultural issues become most pronounced and detrimental. Inefficient processes, entrenched internal politics, and widespread resistance to change (mirroring the “Nothing works” sentiment from Figure 1) significantly increase the cultural drag, making it exceedingly difficult for the organization to adapt, innovate, or regain momentum.
- Phase IV (Long-term Survival): If strategic transformation efforts are successful, CDI can be brought back down, moving the organization back towards the Stability Zone. This indicates a healthier, more adaptable culture capable of sustaining long-term growth and navigating future challenges.
Cultural drag is not merely an abstract concept; it represents a tangible, quantifiable cost to the organization. As an organization scales (Phase II) and then potentially stagnates (Phase III), the initial agile culture can ossify into bureaucracy, internal politics, and resistance to new ideas. This “drag” manifests as increased TTP (slower adaptation, longer new hire ramp-up times) and decreased DoE (employees leaving due to frustration with the culture). These are “hidden costs” because they do not appear on traditional financial statements but severely impact productivity, innovation, and talent retention. Understanding CDI allows leaders to identify and address these systemic cultural issues before they destroy the organization’s ability to transform or even survive.
To clearly delineate the interplay between TTP, DoE, and CDI within organizational health zones, the following table provides a comprehensive overview:
Table 3: Organizational Health Zones: TTP, DoE, and CDI Interplay
| Zone Name | TTP Characteristics | DoE Characteristics | CDI Implications (TTP/DoE) | Cultural/Structural Traits |
|---|---|---|---|---|
| Stability Zone | Low (efficient ramp-up) | High (long tenure) | Low (minimal drag) | Flat hierarchy, transparency, open communication, lean processes, alignment with market trends, next-gen workforce. |
| Transition Zone | Increasing (slowing ramp-up) | Decreasing (rising turnover) | Moderate to Rising (growing drag) | Emerging bureaucracy, some politics, potential misalignment with market, early signs of resistance to change. |
| Decline Zone | High (inefficient ramp-up) | Low (high turnover) | High (significant drag) | Rigid hierarchy, pervasive politics, legacy systems, manual processes, disconnect from market trends, difficulty attracting/retaining next-gen workforce. |
Business and Culture in Transformation
Organizational transformation is a complex endeavor that impacts both the tangible Business Health (e.g., revenue, market share, operational efficiency) and the intangible Culture Health (e.g., employee morale, engagement, adaptability). These two dimensions are inextricably linked, and neglecting one can jeopardize the success of the other. The long-term success of any transformation, and thus the sustainability of Business Health, is ultimately dependent on the health and adaptability of the organizational culture.
Transformation Beyond Digitalization
The graph in Figure 4 shows an example of the trajectory of Business Health and Culture Health over “Organizational Lifetime,” with a critical inflection point marked as “Transformation Beyond Digitalization”. This model provides a crucial perspective on the often-unseen dynamics during periods of profound change:
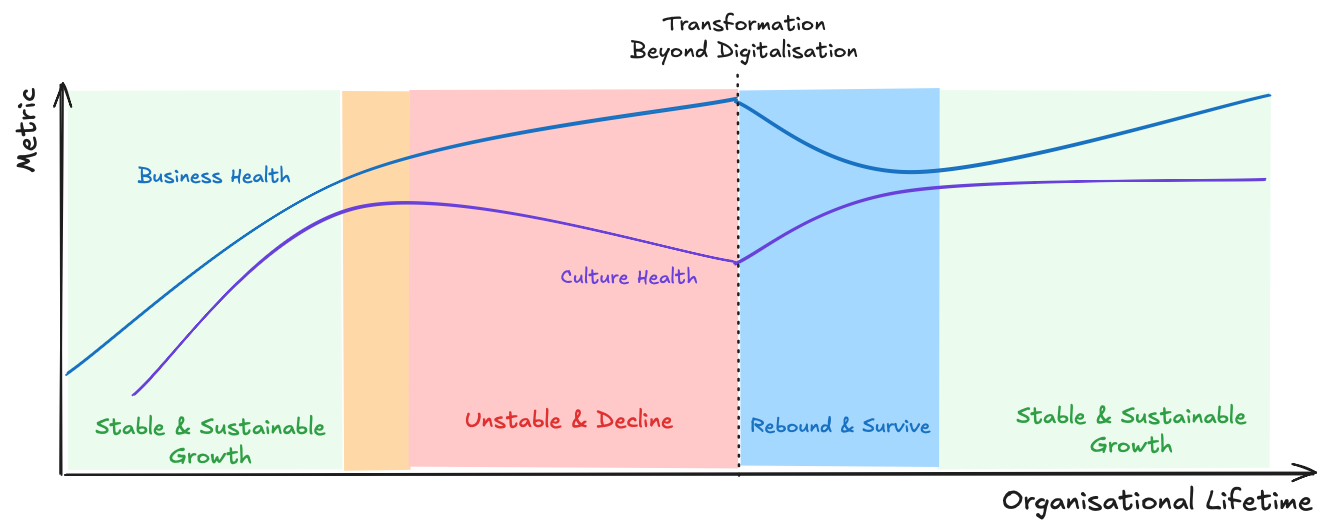 Figure 4: Time Evolution of business and cultural health.
- Initial Growth (Stable & Sustainable Growth - Green Zone): In the early stages, both business and culture health grow steadily, reflecting a healthy, expanding organization. This period is characterized by alignment and positive momentum.
- Pre-Transformation Challenges (Orange Zone): As the organization matures, business health may continue its upward trajectory, but culture health might begin to plateau or show early signs of strain. This indicates that underlying cultural issues or increasing cultural drag might be accumulating, even as the business performs well on traditional metrics. This often precedes the realization that a deeper, more fundamental transformation is needed.
- The Dip in Culture Health (Unstable & Decline - Red Zone): During the active phase of “Transformation Beyond Digitalization”, while Business Health might initially hold steady or even experience a slight dip, Culture Health often experiences a significant and rapid decline. This is a critical period where employees may feel heightened uncertainty, stress, or resistance to the changes being implemented. This dip is a natural, albeit challenging, part of deep transformation, akin to the “unfreezing” stage in change models, where old ways are disrupted. This is a crucial, often overlooked reality of deep organizational transformation. While the strategic intent of transformation is to improve business outcomes, the process of change inherently creates discomfort, uncertainty, and resistance within the workforce. This manifests as a temporary but significant decline in Culture Health. This decline is not a sign of failure but a predictable consequence of disrupting established norms and transitioning to new ones. Leaders must anticipate this cultural strain and proactively manage it through transparent communication, robust support systems, and a clear, compelling vision for the future. Failing to acknowledge and address this cultural dip can prolong the “Unstable & Decline” phase, leading to failed transformation efforts and a loss of valuable talent.
- Rebound and Survive (Blue Zone): If the transformation is managed effectively, Culture Health begins a crucial rebound, pulling Business Health along with it. This phase signifies successful adaptation and the anchoring of new approaches within the organizational culture. It represents the organization’s ability to navigate the inherent challenges and emerge stronger.
- Sustained Growth (Stable & Sustainable Growth - Green Zone): Both metrics stabilize at a new, higher level, indicating a successful transformation that has led to renewed stable and sustainable growth. This demonstrates that the organization has not only adapted but has built a resilient foundation for future success.
The initial business health might be driven by market forces or past successes, but without a resilient and aligned culture, it cannot sustain growth through radical change. The recovery of Business Health in Figure 4 is clearly predicated on the successful “Rebound & Survive” of Culture Health. This implies that investing in cultural transformation—fostering openness, transparency, collaboration, and continuous learning—is not merely an HR function but a strategic imperative for long-term business viability and the ability to navigate future S-curves of growth and innovation.
Conclusion: The Foundation of Informed Transformation
This first part of our series has emphasized that effective organizational transformation begins with a rigorous and holistic assessment of the current state. By analyzing an organization’s position on the S-curve of growth, understanding the dynamics of Time-to-Productivity (TTP) and Duration-of-Employment (DoE), quantifying the impact of Cultural Drag (CDI), and recognizing the interplay between Business and Culture Health, leaders can gain invaluable insights. These diagnostic tools provide a clear, data-driven picture of where an organization stands, highlighting areas of strength, identifying hidden inefficiencies, and pinpointing cultural barriers that might impede future progress.
This comprehensive assessment is not merely an academic exercise; it is the bedrock upon which all subsequent transformation efforts must be built. Without this foundational understanding, change initiatives risk being reactive, misaligned, and ultimately, unsustainable.
Outlook: Part 2 - Driving Change
Having diagnosed your organization’s current state, the next step is to build a lasting transformation. This is less about top-down mandates and more about creating a movement from within. In Part 2, we’ll explore Pull Engineering, a leadership method for initiating change that sticks. We’ll delve into how to identify and equip your internal champions—your innovators and power users—to drive the movement. This requires understanding the influence of your organization’s cultural immune system, the role of Conway’s Law, and how to frame new ideas not as polished solutions but as prototypes designed to provoke imagination. Ultimately, we’ll show you how to leverage digitalization as a catalyst, not a cure, and design a change strategy that avoids resistance by moving from a mandate to a true movement.